A debrief on every session
Open any name and its trading days are already analysed: gap, drawdown, the shape of the day, and notes pinned to the exact minutes that mattered. Your analysts read conclusions and spend their time on judgement, not on scanning.
Eleven thousand names, one table
Behind the app sits the ontology: six types, and every US ticker as an entity with name, sector, exchange and index membership from real reference data. Filter it, facet it, sort it. This is the table your screens wish they were.
The ontology, opened
This is not a viewer over someone else's schema. In Ontology Manager the model is yours to walk: every type, its properties, its actions, in one place. Open the stock type and the whole index facets itself: sectors, sub-industries, headquarters, founding years, and 21 million points behind each series, one click from any question.
Described, not developed
There was no engineering project behind that screen. The analysis was described to an agent over MCP, which built it against the workspace's ontology: a function, an action on the stock type, a dry run to prove it. Minutes, not sprints.
You own the logic
What the agent wrote is plain TypeScript sitting in your workspace, typed against your ontology, readable by anyone on the desk, editable in place, versioned with every run recorded. If compliance asks why a note exists, the answer is forty lines of arithmetic, not a vendor's model.
Risk rules you can read
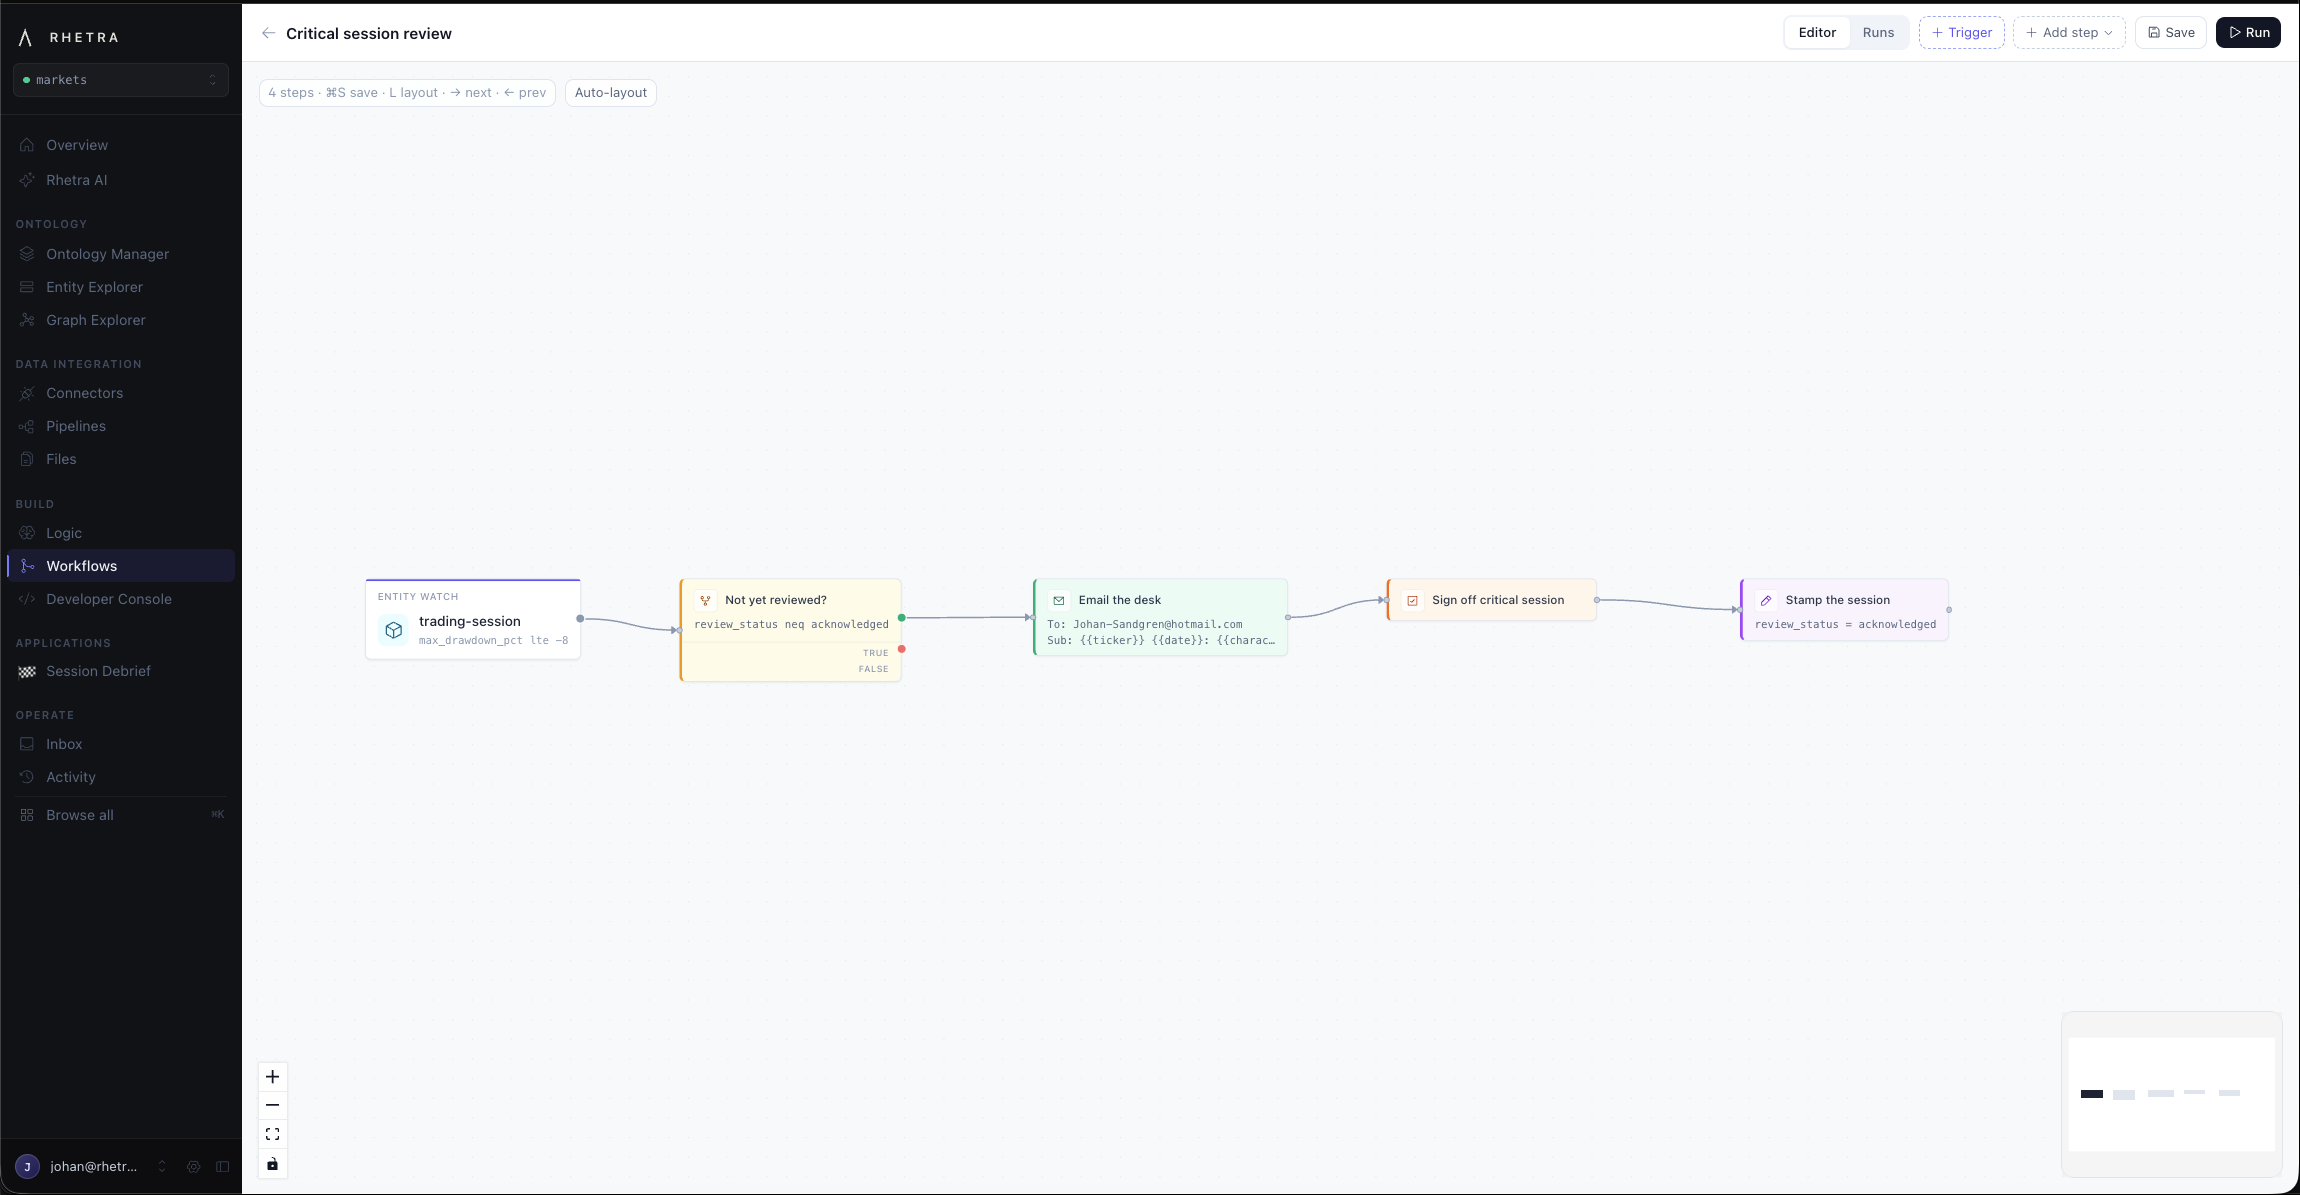
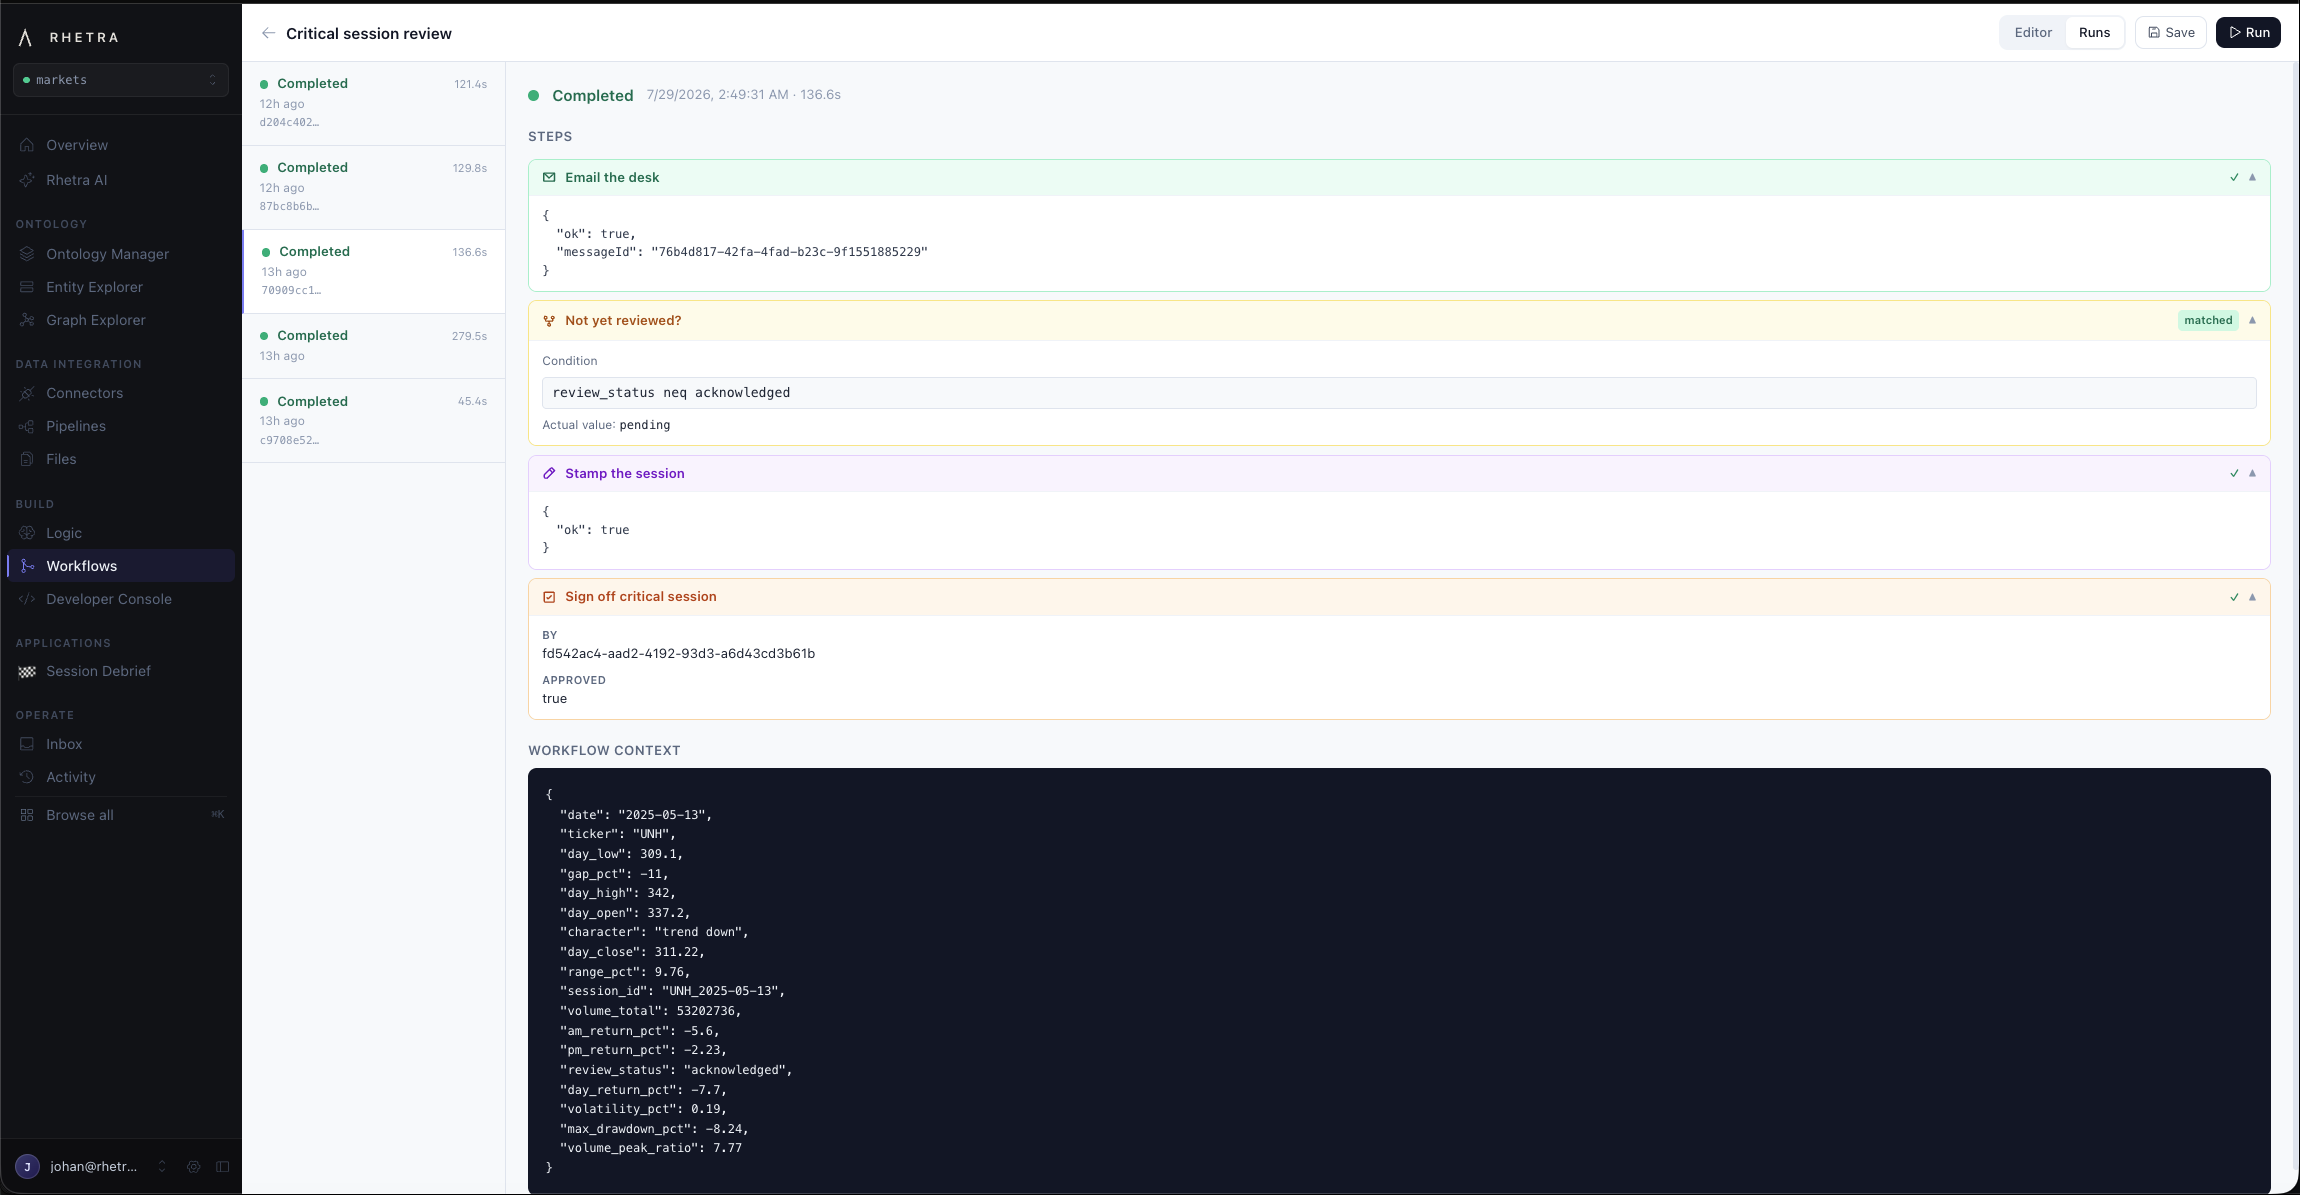
The escalation policy is a flowchart anyone on the desk can audit: watch every trading session for a drawdown past the line, skip what's already reviewed, email the desk, hold for a human sign-off, stamp the session. And every run keeps its receipts: each step's real output, the condition that matched, who approved, and the full session context it fired on.
Exceptions find you
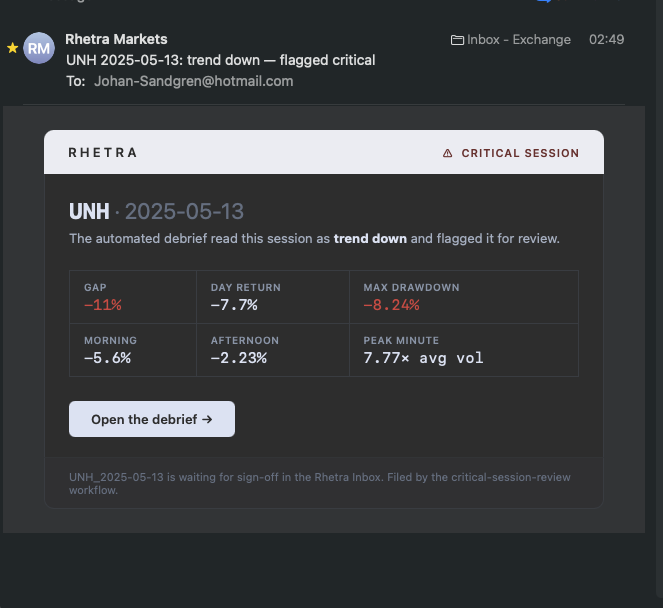
Ordinary days stay silent. A session that crosses the line lands in the desk's inbox at two in the morning with the numbers and a deep link, and opens a sign-off in the review queue. The approval is written back onto the session itself, so the audit trail is the data.
Is that flush a pattern?
The debrief kept filing the same shape: a hard drop from the open on one burst of extreme volume, then a recovery into the close. UNH's May 15th was the loudest one. So the desk asked the agent the obvious next question, the same way the debrief itself was built: make it a signal, scan the index, and backtest it.
Watch what that becomes: two functions, two actions, a market-wide sweep, and a backtest: the hypothesis written down as an entity with its thresholds as properties.
The signal lives on the chart
Every chart the sweep fired on now carries the evidence: the trigger minute marked on the tape, the outcomes beside the debrief notes, and the verdict on every occurrence: 76% of 136 flushes recovered by the close, averaging +0.92%. The dots on the day chips are the sweep's findings; LITE's was the best trade in the sample, +7.31% from trigger to close.
And because occurrences are entities, the research view is free: facet 136 events by trigger time, drop, volume and outcome in the Entity Explorer, or open the report itself.
Everything about a name
Properties from your reference data. Ten thousand minute bars behind one panel. Sector and exchange as real links. Every debrief that ever ran, in the action history. The machine's analysis and your analysts' notes live on the same entity, which is what makes the next question answerable.
And how it all connects
Drop a name on the canvas and expand it: its sector, its exchange, every debriefed session, and the analyst notes filed against them, each edge a real relationship in the ontology. The machine's work and the desk's judgement, one graph.
Ingest a new tape, get the same machine
Everything above ran on prices and reference data. Later the desk wanted a stranger feed, so 3,436 Truth Social posts were ingested into the same workspace and every market-hours post got measured against SPY: five minutes, sixty, the close, a z-score against that day's own tape. Same primitives, new tape, another app. The famous one, "THIS IS A GREAT TIME TO BUY!!!", posted 09:37 on April 9, four hours before the tariff pause: +946 bps to the close. And the attribution table says what a vendor never would: two posts share the window, not separable. No analyst reads 3,436 posts. The model measured every one.
Your data. Your logic. Your judgement.
The platform runs it.
This workspace was built in days on ordinary platform primitives: datasets, an ontology, one function, two workflows. Yours would look like your business instead of the market.
Get in touch