One prompt, sourced and loaded
The ask: join a public warning archive to the miners' actual sites. The agent found the IEM VTEC archive, located all nine mines by coordinate, resolved each one's NWS county, forecast and fire zone, and pulled 3,718 warnings across all three. Zone codes matter: heat and red-flag products are zone-coded and invisible to a county-only pull.
The session over MCP, compressed. The pause is the schema approval.
The agent proposes; you approve
The agent cannot change the model on its own. Two object types and two link types land in the Review Inbox as a proposal. Additive only, import blocked until a human approves. One click later the schema exists and 3,727 links materialize with zero unmatched rows.
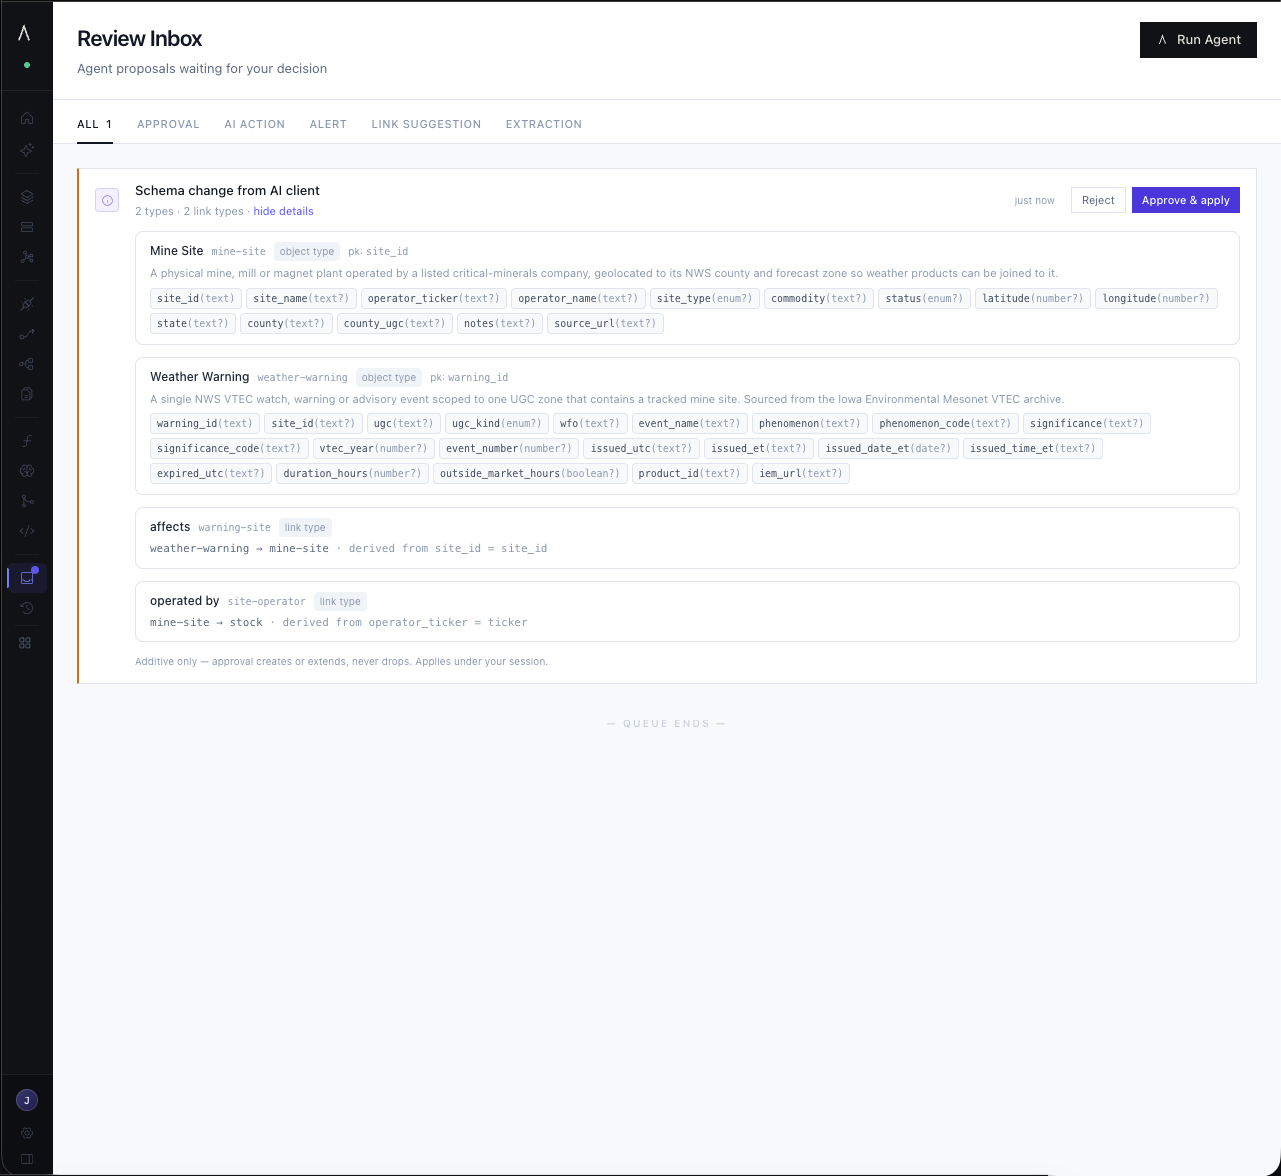
mine-site · weather-warning · warning-site · site-operator · additive only
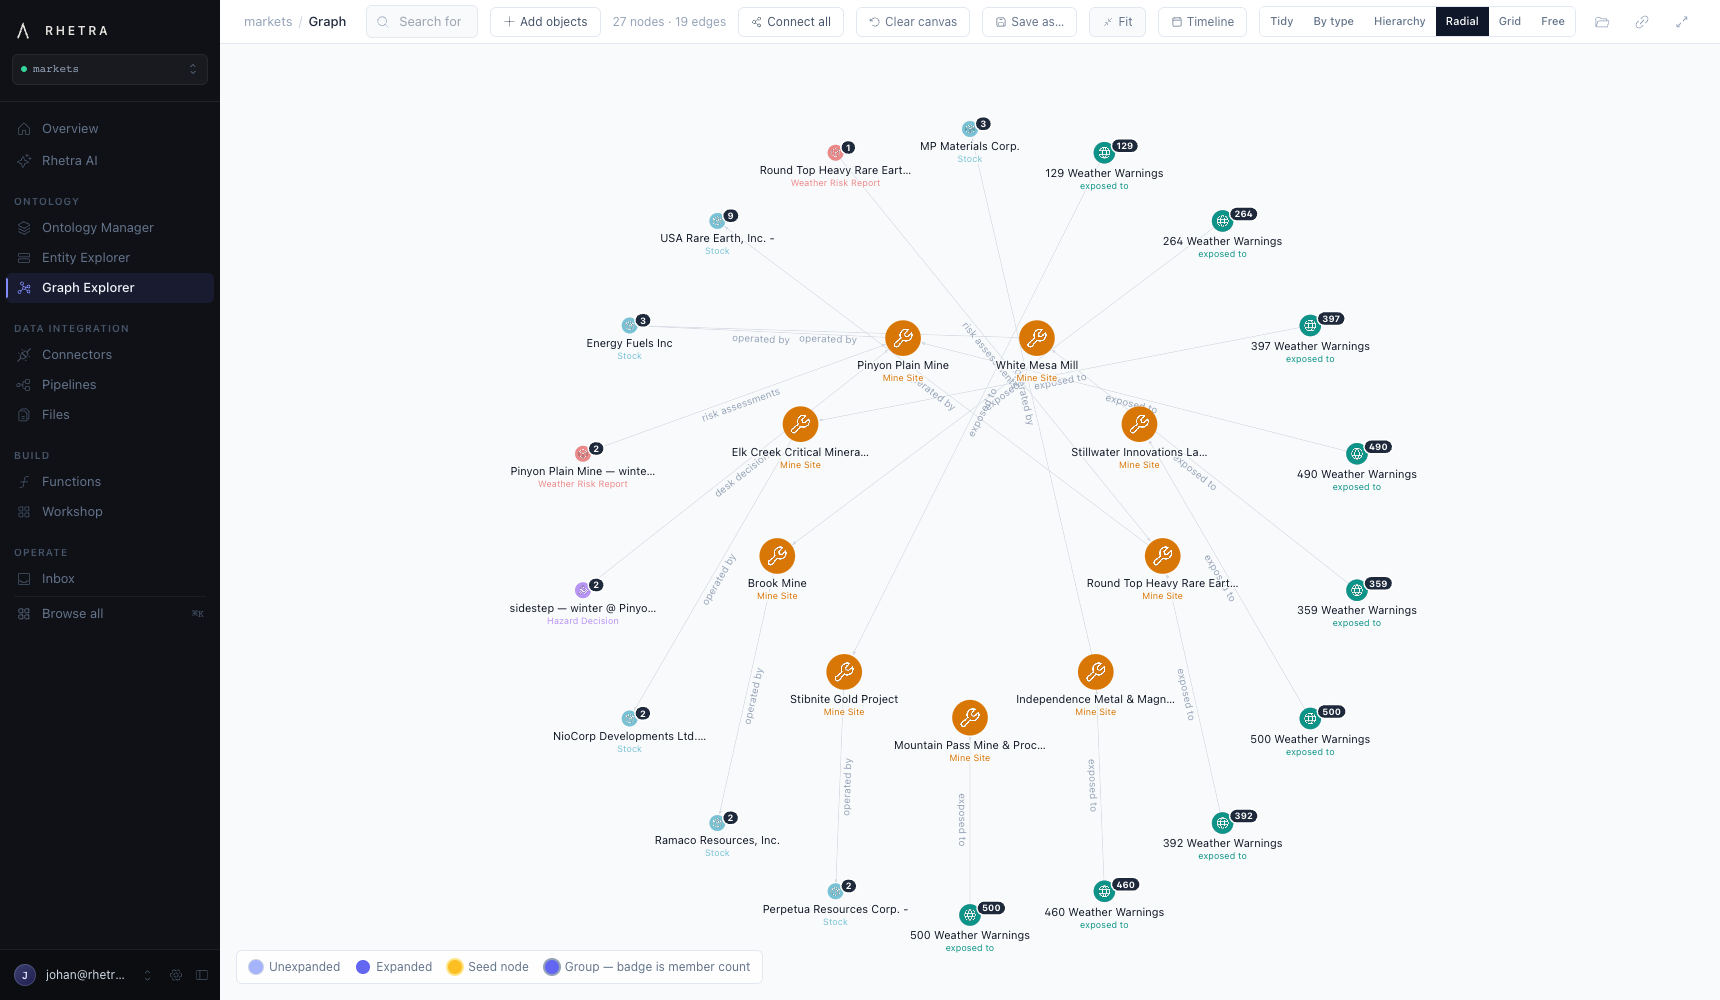
Weather is now part of the graph
Drop the nine sites on the canvas and connect. Each mine carries its warning history as a grouped node: 490 at Pinyon Plain, 583 at Mountain Pass. Operators resolve through the ticker join. The risk reports and desk decisions from the apps hang off the same nodes. One graph, no glue code.
Functions compute; actions commit
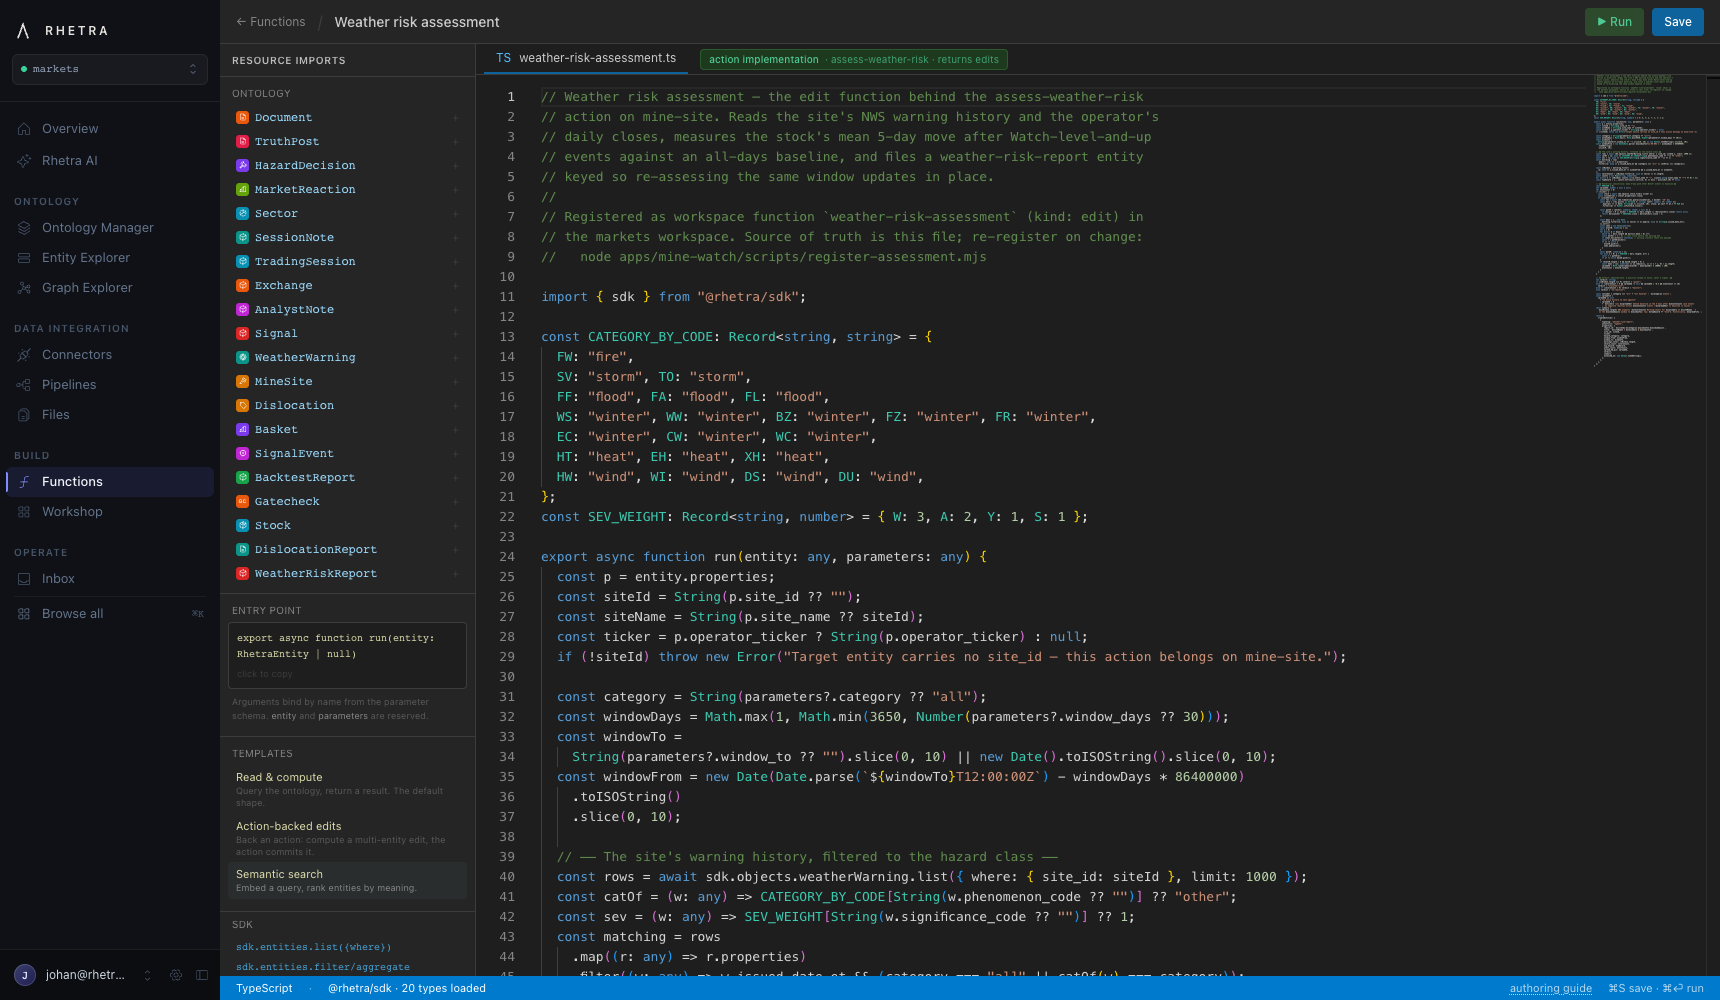
weather-risk-assessment reads a site's warning history and the operator's
tape, measures the mean 5-day move after severe events against baseline, and returns
an edit set. Functions are read-only by construction. This one only
writes because the assess-weather-risk action commits its edits as one
audited submission. A second function, hazard-sensitivity-matrix,
is pure compute: the fleet-wide event study the desk app calls live.
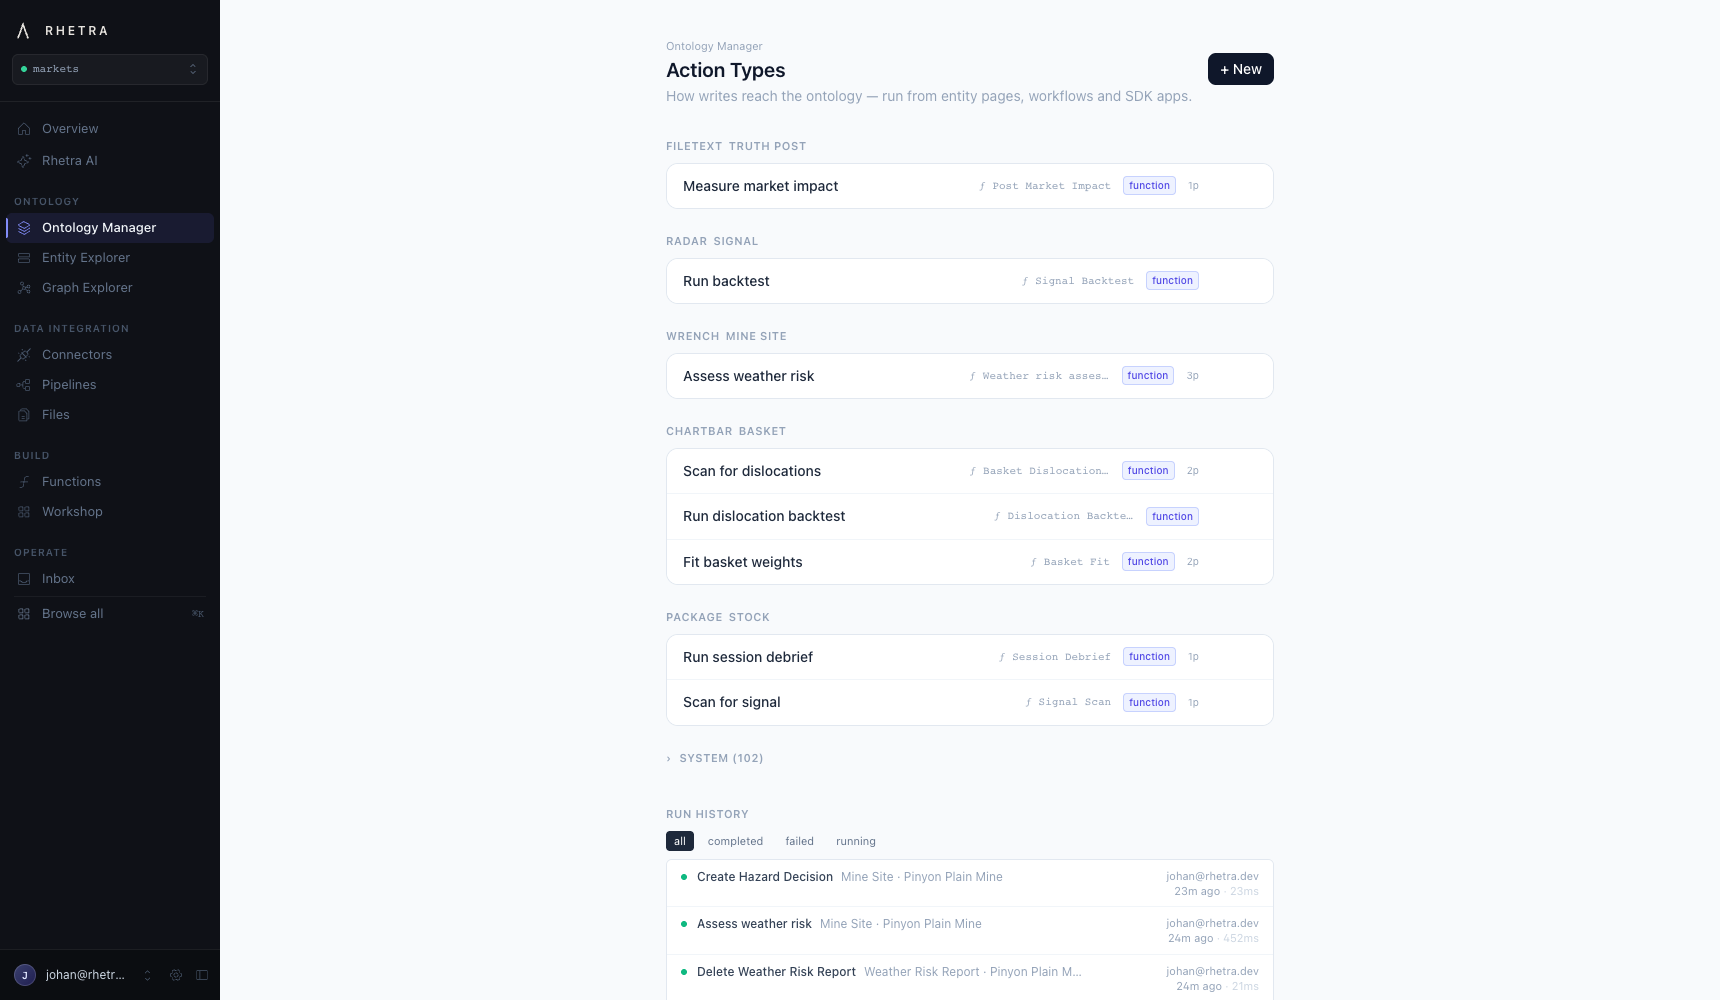
In the Ontology Manager the action sits on the mine-site type like any other write path, with its parameters and submission criteria. The run history below it is the demo you are about to watch. Assess, decide, delete. Every write is a run.
Sixty seconds, everything above in use
Winter 2023 sweeps the map and Pinyon Plain goes red under four Winter Storm Warnings. The reaction chart shows the tape around the exact announcement. The assessment files through the action and comes back elevated risk. Then the desk: the sensitivity matrix, the winter thesis at −1.8% over five days, n=64, t=−2.1, and a sidestep decision written back to the ontology, linked to the report that argued for it.
From a hunch about rain
to a governed decision loop.
The weather archive, the mines, the stocks, the evidence and the decisions live in one model. Every screen reads it. Every write went through an action.